Support and resistance is the most popular concept in technical analysis.
First, we’ll focus on understanding the basics. Next, we’ll go through horizontal and trendline support and resistance and lastly, we’ll look at three key ways to use support and resistance.
Part 1: Horizontal support & resistance with examples.
Part 2: Trendline support & resistance with examples.
Part 3: Three main ways to use support & resistance.
Part 4: Summary
There is only horizontal and trendline support and resistance because trendlines cover all the non-horizontal support and resistance.
Support and resistance is a key concept you must understand to be good at technical analysis; it’s connected to most technical analysis strategies. Picking between indicators or support and resistance, I’d pick support and resistance with no hesitation.
Support and resistance are areas where a trend can likely reverse direction. Support is where price may move up from, and resistance is where price may move down; they can act like price barriers.
They are a tendency of the markets which result from herd behaviour. Traders are likely to put market orders around support or resistance levels.
Part 1: Horizontal support & resistance with chart examples.
To help understand support and resistance, think of support like the floor and resistance like the ceiling.
Resistance levels indicate a surplus of sellers, and support levels indicate an abundance of buyers. You may draw them as zones instead of levels to cover a broader range of price action.
Look at the chart to see support and resistance zones.
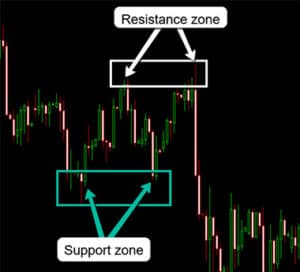
As price moves on, new support and resistance levels form. The support level is the lowest point where price moves up, as shown by the green rectangle (the opposite is for resistance). The highest point before price started to move down was the resistance level, shown by the white rectangle.
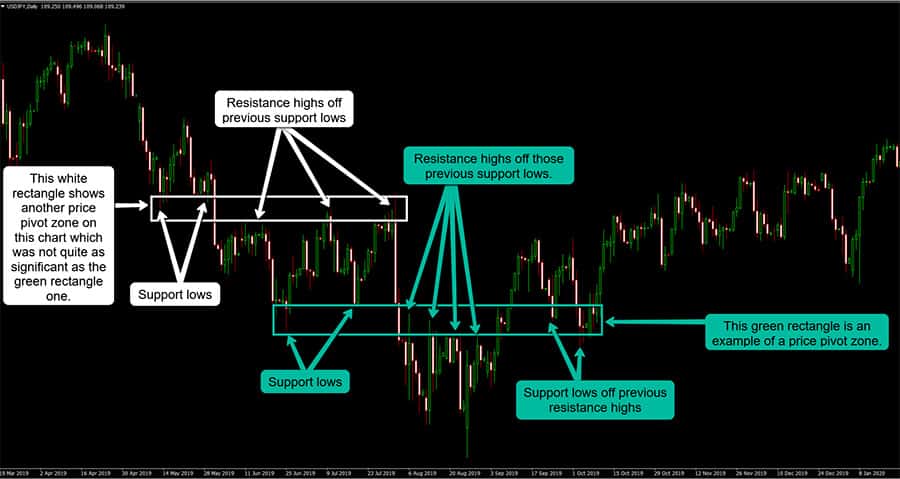
Now look at the same chart but notice how we can draw the same green rectangle line as resistance instead of support.
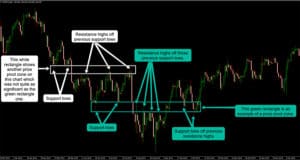
Notice how the green rectangle became support again after price closed above it. OK, now you’re trying to confuse me on purpose, say’s Newbie Nick. We went a bit fast; let me explain what’s happening.
As price breaks through the support level and closes below it, you can think of it like going downstairs in a house. The higher floor you were on previously is now the ceiling because you’re on the lower floor. The resistance level acts like a ceiling to reverse price to go down.
After price moved down off the resistance level, it came back up and closed above it. It’s like walking upstairs two floors higher in the house. So now the floor you are standing on is the ceiling from the floor you originally started on. The floor is acting as support; this is a price pivot zone (as seen on the chart).
It’s an inexact science; it involves discretion to pick the best price pivot zones.
Also, remember it’s only sometimes the case that price will close below the support level or above a resistance level. Often price may test a support or resistance level and not break through it.
Typically, more substantial support or resistance levels will have more significant swings off it.
Of course, there are other factors to consider, but this is a significant factor to learn for beginners as it’s simple to see on the chart.
As you can see, understanding the basics of support and resistance is simple enough. The challenging part is identifying good enough support and resistance levels or zones.
Two ways of drawing horizontal support & resistance
How you draw horizontal support and resistance depends if you want to use levels or zones; each has advantages and disadvantages.
Zones will decrease your profit and risk because you use a broader range. For beginners or anyone struggling, it’s recommended to use zones instead of levels. It helps you identify suitable areas to draw support and resistance and build confidence.
Many consistently profitable traders use zones instead of levels; one way is not better than the other. Remember, these levels are not rigid barriers and are not always exact.
Part 2: Trendline support & resistance with chart examples.
Next, we will move on to trendlines – one of the most popular trading tools.
I’m guessing you’ll try and explain it by saying the house on an angle instead of being flat, says Nick. You can view it like that if that helps, but now you know the basics of horizontal support and resistance, you won’t think of it like that. Trendlines work the same way as horizontal support and resistance except at an angle.
The upward trendline is often called an ascending trendline, and the down trendline is a descending trendline.
All you have to do is connect either at least two tops or two bottoms. It takes two tops or bottoms to draw a trendline, but you want at least three tops or bottoms to confirm the trendline. Look at the chart for examples of ascending and descending trendlines with two or more tops or bottoms.
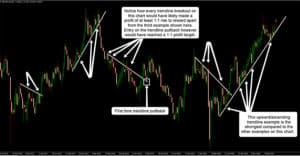
Here are a few vital trendline tips. The first tip is that the steeper the angle of the trendline usually, the less reliable it will be; look at the two trendline examples to see what I mean.
The other tip is that trendlines will become stronger the more times price tests it (like horizontal support and resistance). Only use the trendlines tested many times, as there will always be other opportunities.
Earlier, we drew horizontal support and resistance as a zone and as a level. For trendlines, drawing them as levels and not broad zones is recommended. Use the candlesticks’ highs and lows or the closes to draw trendlines. Also, you can use a mixture of highs or lows along with closes.
In this example, it’s better to draw the trendline like this instead of trying to draw it using the highs. As you can see, when only using the highs, the trendline leaves a gap. Avoid getting into a bad habit of doing this, as you’ll likely grow this habit over time. If you do this, you may occasionally draw trendlines with a slightly larger gap and then even larger gaps etc.
Part 3: Three main ways to trade using support & resistance.
Next, we’ll go through the three main ways to trade using support and resistance.
It’s stronger to trade with more factors than only support and resistance. A support and resistance level is just one factor for entering a trade.
The first way is to trade the bounce, look for price to hold at the support or resistance level and reverse direction. Increase the odds by waiting for price to confirm that the support or resistance level may hold first. Often, you’ll take a loss if you place an order before a support or resistance level shows any sign of holding firm as a reversal level.
Look at this example chart for GBP/USD daily, where price hit the support and resistance levels and then moved away. After this, an entry at the pin-bar or outside bar high or low is less risky than entering before the reversal of price momentum occurred.
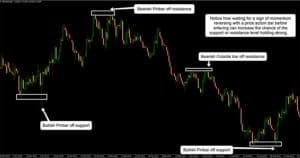
Support and resistance levels often break even if they are strong; therefore, trading them before any sign of a turnaround in price momentum isn’t recommended.
The following way is to trade using the break of the support and resistance levels. We’ll go through an aggressive and conservative way using the break. The aggressive way is to enter on the breakout after price closes through a support or resistance level. Take a look at the chart to see an example of this.
An essential tip is to make sure price convincingly closes above the resistance level or below the support level; this helps avoid a false breakout.
You can also use horizontal support/resistance or trendlines to trade breakouts. Wait for a clear close above or below the trendline before entering. Use a buffer to help, but beware that a reasonable buffer size depends on the market and timeframe. Also, market volatility can change significantly; therefore, you must adjust your buffer size accordingly.
The other way to trade breakouts is a more conservative approach using the breakout and pullback. The breakout and pullback entries are rarer compared to just a breakout. The advantage of this type of entry is that you’ll likely get a tighter entry for a greater risk-to-reward ratio.
To help explain this, look at the example chart.
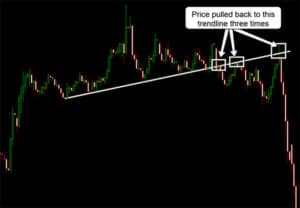
After the pullback, traders are aware that the trendline recently gave two or more swing highs or lows, further increasing the trendline strength. The example has three highs off the trendline, meaning it was very relevant to the market, resulting in a significant price drop. If you want to check this example, it was from GBP/USD daily in February 2020.
A typical entry technique is the recent trendline breakout plus a horizontal swing low breakout. Combining the horizontal swing low support level with the trendline pullback level – we have two factors increasing the odds for the trade to do well. This entry is the most beginner friendly as you’ve got two factors to help. The horizontal swing low level may hold if you pick a weak trendline. The problem beginners have with this type of setup is patience because it’s rarer than the other entries explained earlier.
OK, so how can you say this simple stuff is better than my sophisticated indicator trio which I’m paying $100 a month for, asks Newbie Nick.
There’s nothing wrong with using multiple indicators; however many traders add them in because it makes them feel smart or because they know other traders use them. Filter trades using each indicator versus trades not using the indicator to see the difference in the results. If your results over a large sample size of trades are better by using an indicator, then by all means carry on using it.
Be aware though, that almost all indicators are lagging, however price action shows what’s currently happening in the markets.
Summary
Support and resistance are the foundation of technical analysis. Many price action setups and indicators use support and resistance. The techniques explained in this post referred to price action; however you can also apply support and resistance to indicators such as Moving Averages, Bollinger Bands, etc. First, learn support and resistance with price action to understand the concept.
Key takeaways:
- Support and resistance are price levels where trends can often reverse direction. Support is where price may move up, and resistance is where price may move down.
- Support is due to a concentration of demand, and resistance is due to a concentration of supply.
- Market psychology plays a massive role as traders remember past market behaviour. It’s a market tendency that results from market participants’ herd behaviour. If traders see a support or resistance level, they will likely decide to put market orders around those levels.
- Indicators can also show support and resistance.
- Combine support and resistance with price action momentum bars such as outside bars or pin-bars to increase the chance of the level holding firm.
- If price closes below a previous support level, it will often become resistant; if it closes above a resistance level, it will often become support. This is what a price pivot zone represents.
- The three main ways to trade support and resistance are 1. The bounce 2. The breakout 3. The breakout with a pullback.
If you found value in reading this, check out the related post about 3 key trendline factors you must know.

