We’ll look at key insights from Secrets for Profiting in a Bull and Bear Market by trading legend Stan Weinstein.
Here are the key topics we’ll go through:
- Stan Weinstein’s philosophy on investing
- Refining the buying process
- Short selling
- Using the best long-term indicators to spot Bull and Bear markets.
The concepts we’ll go through can be applied to both short-term and long-term timeframes; therefore they can be useful for both traders and long-term investors. As we uncover secrets for profiting in a bull and bear market, let’s look into a fascinating story.
It’s October 1987, and an extraordinary event would make many believe Stan Weinstein had psychic powers.
The event known as Black Monday saw the Dow Jones market crash by over 22% in a day. Even more incredible than this would be the fact that Weinstein predicted the crash and would go on to become famous for it. Soon after, he’s featured on numerous TV shows, including Wall Street Week and Moneyline.
So how did he predict the event with great accuracy?
Let’s dive into the book to learn how he achieved this.
Stan Weinstein studied a stock’s recent trend and applied cyclical stage analysis theory. The book looks at the continuous cycle of stocks from bottoms, tops, breakouts, uptrends, and downtrends. Each stage is an opportunity to potentially profit from an investment.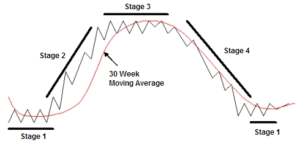
He’s looking for stocks in one of his four market stages, the basing, advancing, topping, and declining phases. Stages one and three show that price is moving sideways and is backed up by a leveling out of the moving average.
The optimal period to go long would be between the ends of stages one and two, and the best moment to sell would be between stages 3 and 4. There are additional things to consider before buying or selling, and keep in mind that Stan is utilizing this framework to tilt the probabilities in his favor.
The initial stage begins at the bottom of a downtrend, where new buyers come into the market with fresh hope. They replace old shareholders, many of whom would have sold out of fear. The new buyers entering the market are hopeful; however, many will become greedy if the stock increases in price. As price comes out of a stage 1 basing phase, we can watch to see if volume increases as we transition into a breakout to stage 2.
After price has broken out of a range, you can wait for a potential pullback for an entry to increase the risk-to-reward ratio. Entering on a pullback will allow for a tighter stop loss placement enabling a larger potential reward compared to the amount you’re willing to risk on a trade. However, the major disadvantage of waiting for price to pullback is that sometimes it won’t occur and therefore you’ll miss out on the trade.
The next stage is the uptrend or advancing phase, where buyers are aggressive early on. Later more buyers come in, however they are more likely to be trend followers with a fear of missing out rather than having a logical decision to enter the market. As this phase develops, we begin to notice the market diverging, and many early buyers start to take profit. Most investors make the mistake of focusing too much on stage 2 as they fear missing out on a long uptrend. According to the book, there are better bets than looking to buy high and sell higher.
The following stage is the stage 3 topping phase, where we see the market top out and transition into a downtrend. The phase can only partially be confirmed after the beginning of stage 4, although informed market participants can begin to predict the market rounding off. Price bars start to show signs of divergence as they fail to reach the upper part of the trend top.
The final stage is the declining phase which marks the beginning of the downtrend. Many greedy buyers stay in and eventually begin to panic sell as price begins to drop. The level of volume and volatility is often great at the beginning, similar to the phase 2 breakout. Selling during the early part of phase 4 results in higher potential reward but also higher potential risk. A major reason why is because the market has yet to establish a downtrend of lower highs and lower lows. There’s a possibility that a bullish news release could create a quick transition into a stage 1 bottoming phase in a short period. If a stage one bottom phase were to occur shortly after going into a stage 4 decline, then the whole cycle would start over again.
Volume also plays a key role in his strategy as it helps indicate the amount of shares traded over a period. A vital point regarding the strategy is that the greater the volume at the breakout point, the greater the bullish signal.
Let’s look at a stock chart example to see how stage analysis can be applied.
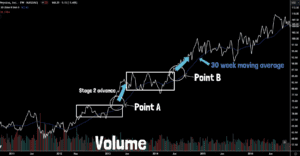
Here we see price entering a stage 2 advance at the first breakout of resistance. However, soon after price moves into a channel, and at point B price breaks out again above the resistance level and 30-week moving average. Overall, the move resulted in over a 200% increase in price.
To help seek maximum returns, Weinstein mentions that investors should try to enter around point A. However, he states that traders potentially looking for shorter term moves should mostly be looking to get in around point B for a stage 2 trend continuation breakout phase.
Here are four critical factors for the strategy:
- Check if the stock price is over the 30-week moving average to go long or below the 30-week moving average to go short.
- Look for a breakout above resistance to go long.
- Ensure that volume is much higher than at the breakout point compared to previous weeks.
- Focus on the weekly timeframe or higher; this strategy is not recommended for short-term trading.
Another technique Stan Weinstein discovered is the triple confirmation pattern as you can see an example of here. He developed this technique by using professional tape readers in the mid 70’s. The example here shows a stage one breakout plus higher volume breaking out from the 30-day moving average.
Also, a major part of his method is the Mansfield relative strength indicator which you can see here. The Mansfield RS as it’s commonly known, helps compare stocks by looking at the relative strength of each, often with a 52-week moving average.
Many popular charting software no longer has this indicator; however you can find it using TradingView charting software. You have to click on the indicators button then search the community scripts for the Mansfield Relative Strength (Original Version) and add it.
To use the indicator, be aware that when the relative strength is above zero, it shows stronger relative strength than the stock it’s comparing against. However, when the relative strength is below zero, it indicates weaker relative strength.
Let’s look at another example of a triple confirmation pattern with this stock chart from Procter & Gamble.
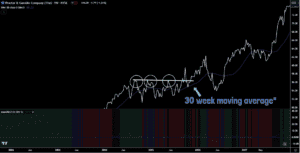
Here you can see price increased by 35% in 12 months at the triple confirmation breakout point. As price closed over the 30-week moving average and had a breakout of resistance, we would be looking to go long. Additionally, the relative strength indicator going from negative to positive shows that we have bullish momentum.
As an investor, Stan Weinstein focuses on the weekly timeframe or higher. He believes that any shorter timeframe than a week only makes sense if you want to pay a lot in fees and make your broker more money.
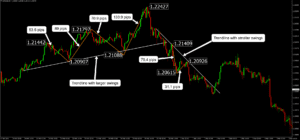
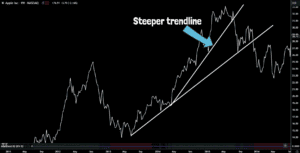
Another important aspect of his strategy is the use of trendlines. He only considers trendlines with at least three or more touches; the more touches, the more significant it is. For example, a trendline with four or more touches, would be considered.
He also mentions the trendline angle is important to analyze as a steeper trendline can often result in a steeper breakout. Look at the ascending trendline here with a lower breakout point compared to this steeper trendline with a higher breakout point to see the difference.
The book mentions it helps greatly if you stay disciplined and do not become emotionally attached to a stock. If it’s logical to sell a stock and your plan says you should sell, then you should not hold onto it. Understanding market psychology is critical to executing logical trades. Emotions like greed and fear are key drivers of the markets, and you should be aware of these emotions during your stage analysis. Weinstein often takes a contrarian approach by buying when other market participants are fearful and selling when other people are being greedy to maximize returns. A tip to help with this is regularly updating your trading journal to note your emotions and the market’s emotional conditions. A trading journal also can help develop trading techniques and improve decision-making skills.
Here are further key points about his strategy:
- Diversify in various sectors to help reduce portfolio risk.
- Short stocks when entering a stage 4 decline if all other conditions are right.
- Make sure stop losses are always used and placed according to major support and resistance zones.
- Consider buying pullbacks after a powerful breakout.
Despite being published in 1988, the book still has a great mix of concepts, strategies, and psychology tips to help you in today’s markets. The book guides us on the principles of having a well-educated and consistent approach to trading. While some of the strategy techniques in the book are outdated, the core principles of trend analysis remain strong. If you enjoyed reading this make sure you check out more content from the blog.

