We’ll uncover the fascinating Kelly Criterion strategy, often called the fortune’s formula.

Picture this: computer scientist John Kelly in 1956, armed with his genius and pen and paper, would forever drastically change the investment world.
Fast forward to the present day, and we find ourselves mesmerized by the legendary Ed Thorp, who popularized this mathematical marvel by employing it to conquer the treacherous realm of blackjack. Not to mention, Jim Simons, founder of the Renaissance Medallion Hedge Fund with over $130 billion, also ventured into the world of the Kelly Criterion.
What is Kelly Criterion?
Many scholars have proposed various solutions to try and create an optimal risk management formula for investing in the financial markets. The Kelly criterion based on the work of John Larry Kelly Jr, a Bell Labs researcher is one of the most popular attempt at finding a solution.
Kelly formula uses the logarithmic function in his studies. He shows that the logarithmic function maximizes the long-term growth rate, but it is myopic in that it maximizes capital only in the current interval, independent of previous or future information. Essentially, Kelly tried to define how much is best to risk in a single bet and consequently in a series of bets when the probability and the net outcomes are known.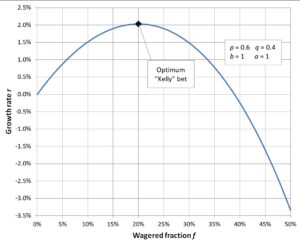
Unraveling the mystery behind the Kelly Criterion
This miraculous calculation serves as a guide toward the optimum stake or position size for any given event. It comprises four essential factors:
- The equity balance
- The expected return from a winning outcome
- The probability of winning
- The probability of losing
Together, they unveil your perceived edge over an event, which can help determine the ideal position size. Unlike conventional wisdom in the investing community, position size shouldn’t be a predetermined input to your strategy. Instead, it should be an output resulting from these four variables working in harmony.
Example
Imagine a tennis match with two players, player A, and player B. The odds suggest that player B, with a more powerful swing, has a 60% chance of victory, leaving player A with a 40% chance.
We set aside our hard-earned money for the tournament, commencing with a betting bank of $1,000.
The exchanges offer an expected return of 1.8, translating to an 80 cent profit for every dollar wagered. With our analyzed true winning probability of 60% and losing probability of 40%, the equation unfolds before us: 0.8 multiplied by 0.60 minus 0.40, divided by 0.8. 2.30 The result? 0.1, or 10%. To determine the optimum Kelly Criterion stake, we multiply this figure by our betting bank of $1,000, yielding $100.
Don’t be put off by all the calculations as you can use a spreadsheet to help calculate it correctly. However you must be able to understand how the calculations are working.
Should our probability align with the market’s offering, the result would be negative, signifying an absence of any edge. Likewise, a higher chance, say 70%, would make us increase our wager, capitalizing on the greater advantage at hand.
Now, let’s delve into trading and investing, where I shall use the Kelly Principle for my trading statistics.
To keep it simple, imagine an equity balance of $10,000. With a long-term win rate, or win probability, of 55% and a losing probability of 45%. 3.19 My expected profit on risk for a winning trade is 3. Therefore, for every dollar I risk, I stand to gain 3 dollars in profit. With this knowledge, we can now use the Kelly Criterion calculation to determine the ideal position size for a trade.
With 3 multiplied by 0.55 minus 0.45, divided by 3, our equation gives 0.4, or 40%. 3.43 Based on the Kelly formula, the optimal amount would be 40% of our $10,000 equity, amounting to $4000.
You might think this seems like a substantial chunk of capital to allocate to a single position compared to the equity balance. For this reason, many embrace the concept of fractional Kelly. Simply put, it means using a fraction of the recommended position size, for example 25%. Remember, this refers to the position size, not the expected risk.
With a typical stop loss, my risk would be approximately 10% of this position size, equating to $100 or 0.5% of equity.
When we use the Kelly Criterion formula within the stock market, we must consider the random element of price movements and ensure variance in our inputs.
Now look at this diagram to help you understand the Kelly Criterion formula.
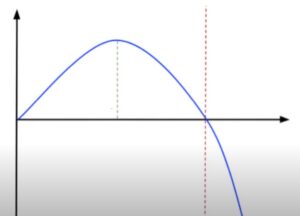
In the center, the green line shows full Kelly while the blue line represents portfolio return. The left side of the full Kelly line (green line) is more conservative, while the right side is more aggressive. The concept suggests that the higher the Kelly means more equity risk and more volatility; the opposite is true for lower Kelly. The optimum position size finds its sweet spot here.
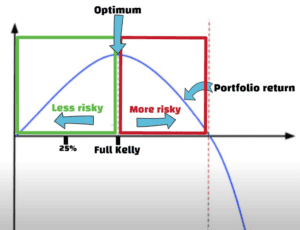
However, you must keep in mind that this theory rests on events with fixed variables and true probabilities, much like blackjack. In the stock market with its variables, it’s wiser to use fractional Kelly if you wish to use the concept.
It’s my preferred tool for helping me with my risk management as it allows me to adjust the risk accordingly to my performance. Many investors, hedge funds, and sports bettors use the criterion. Edward Thorp was the first to apply the Kelly Criterion to the game of blackjack, which he called “Fortune’s Formula.”
In his 1960 book Beat the Dealer, he details the procedure, and his results transformed the way this game was played after he established a winning strategy. In finance, highly successful investors, including Jim Simons of the Renaissance Medallion hedge fund, employ Kelly Criterion techniques in various versions. If you enjoyed reading this make sure you check out more content from the blog.


