First, I’ll explain what flags & wedges are, and then I’ll explain critical factors when using these patterns.
After reading this, you’ll learn practical techniques to help identify trend continuations in any market. Additionally, you’ll learn essential price action tips to help increase the quality of flag and wedge setups.
What are flags?
First, I’ll explain flags, and then I will explain wedges.
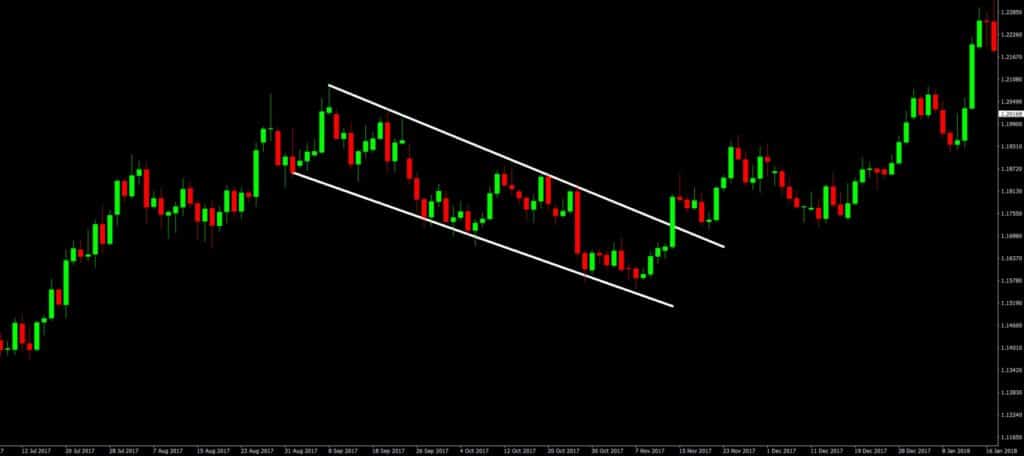
A flag breakout can happen in either direction; however almost all flags are continuation patterns. It’s a continuation chart pattern named by its look like a flag on a flagpole. A bullish flag is called a bull flag, and a bearish flag is called a bear flag.
Flags are less popular than wedges as they are rarer; however, they are very reliable chart patterns and usually more trustworthy than wedges. Flags are often a fast formation appearing as a channel that develops in the opposite direction to the trend. For example, in an uptrend, it has a downward slope, and in a downtrend, it has an upward slope.
The trend must be strong and steep to form the flagpole for the flag. The steeper the trend, the better the flag because you’re trading a trend continuation when trading flags. For example, a flag in an uptrend is often due to buyers taking profit and weak selling coming into the market – pushing price down. Buyers come back in only to be pushed back down by sellers until you get the flag formation.
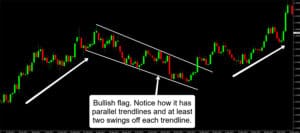
A decent flag has at least three or more swing highs and three or more swing lows off the flag’s top and bottom trendlines, as you can see from the chart.
Three or more swings make it easier to notice the parallelogram-like formation to draw the flag. The more traders that take notice, the more likely the pattern will give a rapid breakout trend continuation.
Before I go through more critical factors for trading flags, let me first explain what wedges are.
What are wedges?
Wedges are when two trendlines converge, causing the magnitude of price movement within the wedge to decrease, causing price compression, which then drives a breakout. Wedges, unlike flags, may not necessarily show a minor trend reversal; they can also signal a pause in the trend. A pause indicates that traders are still deciding where price will go next. Not all wedges are sideways patterns; they also can trend up or down.
Bullish wedges are called falling wedges because they occur in an uptrend, and the trendlines usually slope down.
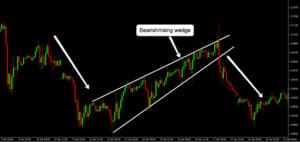
 Bearish wedges are called rising wedges as they are found in a downtrend, and the trend lines usually slope up.
You can also have the opposite happen where a bullish wedge occurs in a downtrend, and a bearish wedge occurs in an uptrend -which I will now explain.
Here’s an example of a rising wedge in an uptrend.
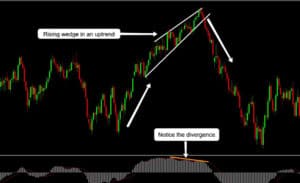
As you can see, the swings bouncing off the trendline formed higher lows and higher highs. This formation shows a potential reversal and slowing down in the trend – commonly referred to as divergence (a simple way of identifying divergence without oscillators). The longer the pattern continues, the greater the chance of seeing a strong divergence signal on oscillator indicators, as shown in the chart with the MACD oscillator.
Falling wedges in downtrends are the opposite of what we went through with the rising wedge in an uptrend. Both the trendlines will slope down, and price will break the upper trendline to cause a counter-trend pattern.
Critical tips for trading flags & wedges
Oscillator divergence is optional, and you shouldn’t get caught up with these signals if you’re a beginner with breakouts. It adds confluence to trades but also may tempt you into weaker trendline patterns. It helps to first focus on finding strong trendline patterns.
With wedges, it’s better if both trendlines have three or more swing bounces off them, as shown from earlier chart examples.
The most crucial trendline is on the breakout side because you want this trendline to hold as support or resistance after price breaks out. Having the non-breakout trendline strong too is a nice bonus; however, focus more on the breakout trendline. The same also applies to flags and other trendline patterns.
When drawing flags and wedges or any other trendline pattern, you can draw them using a candlestick chart or a line chart. It’s easier using candlestick charts as they show the high, low, and open price from each time period – which is beneficial information. Trendlines can be drawn using the highs, lows, or closes of price and even a mixture of them.
Look at the example to see a mix of ways to draw the trendline.
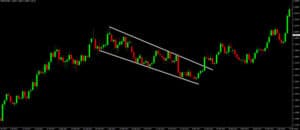
As you can see, the flag’s upper (breakout side) trendline used a mixture of swing highs and swing closes. Compared to other factors, this is not an essential factor, so don’t worry if the trendline uses a variety of swing highs/lows and closes.
Be aware that if price is not touching the trendline by even a tiny gap, this will weaken the trendline.
Look at the example to see a trendline wedge that came very close to touching price but didn’t quite make it.
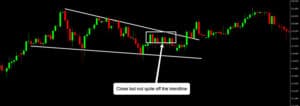
You can get away with trading these; however, it’s not recommended as it will weaken your setups. Instead, try to align the trendline to the price using a mixture of bar highs or lows and closes.
I will now tell you about other significant factors when trading flags and wedges.
A vital tip is to hold greater significance to the most recent touch of the trendline. The logic is that more recent market events are more relevant than less recent ones if all other factors remain equal.
A helpful analogy to understand this is to think of a trendline as a bridge. If the most recent pier is far away from the exit section of the bridge, then the exit section is weaker. Think of the bridge’s exit section like the trendline section breakout.
A considerable distance from the most recent touch from the point of breakout is like having the most recent pier far from the previous pier on a bridge. Similarly, how you’d feel about the bridge collapsing as you exit is the same way traders are concerned if the trendline will hold as support or resistance near the breakout.
Look at the chart example to see how this can happen.
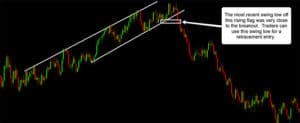
As you can see on the chart, the most recent swing low helped support price. The recent bounce off the trendline gives traders greater confidence using the trendline because the market has recently acknowledged the trendline.
Many traders will use the trendline holding as support for an entry. The reason is that the swing low (previously support) may form a resistance level. If this swing low can act as resistance, traders have an additional factor for stop loss protection along with the trendline. Having two factors will increase the chance that the trade will do well.
Look at this example where price did not form a recent swing low bounce off the trendline.
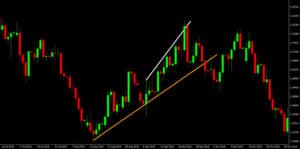 As you can see, the distance between the most recent significant swing low and the next is more extensive than in the previous example. Be cautious trading breakouts based on these trendlines if it’s the only factor. When you see this, it’s common for the market to have another trendline that is steeper and more aligned with recent price action, as you can see here.
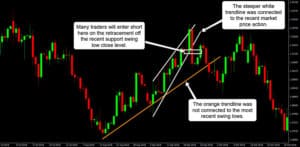
The second trendline is shorter than the previous trendline; however, the market has been respecting it recently (and not the other trendline), which means it was more relevant to the market. The length of the trendline is only one factor out of many to consider when using trendlines.
Summary
Key takeaways:
- A flag breakout can happen in either direction however almost all flags are continuation patterns.
- Have at least three or more swings off the trendline on the breakout side for a decent flag or wedge.
- Hold greater significance to the most recent touch of the trendline. Recent market events are more relevant than less recent ones if all other factors remain equal.
- A rising wedge in an uptrend or a falling wedge in a downtrend will often show a slowing down of the trend – commonly referred to as divergence. It’s a simple way of identifying divergence without using oscillator indicators.
- The most recent swing high/low is often used for a retracement entry because it may form as support/resistance – adding a factor for stop loss protection (along with the trendline breakout pattern).
Flags and wedges are handy tools for many, so it’s worth practising them. If you’re interested in learning more about trendline patterns, check out the related content below.

