I’ll begin by explaining what the MACD indicator represents and then explain how to use it to identify trend reversals. You’ll also learn how to effectively use MACD indicator with price action in MT4 and other software.
The MACD techniques explained can be used in any market; however, they work best for forex or stock trading. Be sure to read till the end because I will share a vital bonus tip with you later!
What is MACD
MACD is one of the most popular indicators for forex and stock trading. It is a momentum indicator that shows the relationship between two moving averages.
MACD stands for Moving Average Convergence Divergence.
A significant reason traders use MACD is to calculate divergence related to the market’s price action, which helps signal a trend reversal. It is an oscillator indicator like other common indicators such as RSI or stochastics. Oscillators are tools that construct high and low bands between two values and then build a trend signal that fluctuates within these bounds. They are momentum indicators that typically fluctuate between a higher value and a lower value derived from a market’s price action.
When used along with price action, MACD can be a very powerful tool, mainly when swing trading, because it can indicate when trends are slowing down or speeding up.
The MACD default settings are the settings that I recommend using, as most traders are analyzing the MACD based on these settings. The default settings for MACD in MT4 are 12, 26, and 9. The first number, 12, shows the number of periods used to calculate the faster-moving average, and the second number, 26, indicates the number of periods used for the slower-moving average. The third number, 9, is the number of bars used to calculate the moving average of the difference between the faster and slower moving averages.
This difference is plotted by the vertical lines you can see here, which is called the histogram.
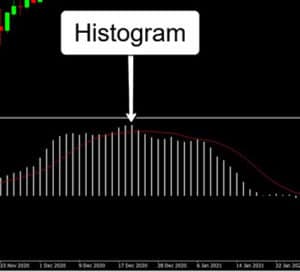
Many people think the histogram is a moving average when actually it’s the difference between the two moving averages. The reason why it’s called MACD divergence because the faster-moving average is moving away or diverging from the slower-moving average. If the opposite happens where the faster-moving average is getting closer to the slower-moving average, this is called convergence, and the histogram smoothes out. That’s how you get the name moving average convergence divergence.
The default settings for MACD use exponential moving averages. There are two commonly used moving averages by traders, the first is called the exponential moving average, and the other is called the simple moving average.
The difference between exponential and simple moving averages is the following. The exponential moving average places greater significance on the recent price changes than a simple moving average. However, the simple moving average applies equal weight to all the price changes within the calculation period.
How to apply MACD
OK great, now that you understand what MACD represents, I’ll show you how to use MACD. I may refer to the exponential moving average as EMA now that you know what it is.
Generally, MACD indicators are commonly used in one of two ways: by crossovers or for signalling divergence in the market. First, I’ll explain crossovers, and then I’ll explain how to use it for divergence.
MACD crossovers explained
Crossover sell signals appear when the MACD signal line crosses below the baseline, and a buy signal occurs when the MACD signal line crosses above the baseline, as shown in the chart below.
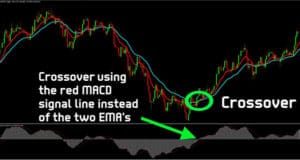
Traders also consider the crossover speed as a signal to see if the market is heavily overbought or oversold.
Another common technique used to identify a crossover is by looking at each of the exponential moving averages. MACD has a positive value when the 12-period EMA, shown by the red line (in the image above), is above the 26-period EMA, shown by the blue line. A negative value is the opposite; therefore, it’s when the 12-period EMA is below the 26-period EMA. As there’s a faster and slower-moving average, the faster one will react faster to price movements than the slower one, which can result in a moving average crossover. In the example chart, the crossover resulted in a reversal of the trend.
Out of the two ways to look for a crossover signal, I prefer using the first one – where we look for the signal line to cross above or below the baseline of the MACD. The simple reason is that it uses fewer lines, reducing the clutter on your charts while giving a similar result.
You may also have noticed that as the crossover occurred, the histogram temporarily disappeared because the difference between the fast and the slow-moving average at this point is zero. The more distant the MACD histogram is above or below the indicator’s baseline, the greater the distance between the two EMA’s is growing. When the histogram crosses over to the other side, it indicates a potential trend reversal.
MACD divergence explained
Let’s now look at how to use the histogram to identify divergence. Divergence occurs when the trend does not align with the indicator. In other words, the indicator trends in one direction while the price goes in the opposite direction. Divergence in a downtrend occurs as price makes lower swing lows, and the MACD histogram ascends when you connect the lower swing lows, as seen in the chart.
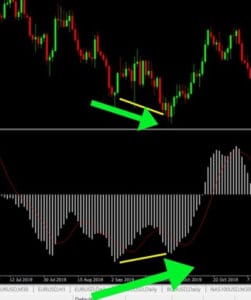
If the MACD histogram is descending, this means the opposite: the trend is not slowing down.
It’s crucial to align the MACD histogram with lower swing lows, as shown in the examples. Regular divergence in an uptrend is the opposite of what we just did for the downtrend example. We connect the higher highs, and if the MACD histogram is descending, we can see the divergence. There must be an ascending or descending angle for divergence. If the MACD histogram is flat, there is no divergence.
Greater importance should be placed on the divergence signal if price makes a new swing high or low while this pattern continues. Take a look at this example of a continuation of divergence.
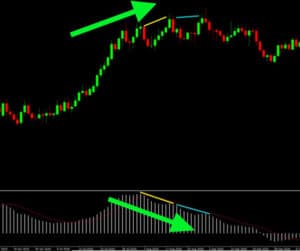
As price continued to form another swing high, we still diverged from the previous swing high; therefore, price continued diverging. This continuation of divergence adds further weight to the divergence signal, and many traders will take more notice if this occurs.
OK, so now regarding timeframes, there’s no such best timeframe; however, when starting, I recommend looking for these MACD signals on the monthly, weekly, and daily timeframes. The higher timeframes carry more weight, and it’s easier for beginners to take their time when analyzing a chart compared to intraday trading.
Be aware that MACD has some disadvantages as well as advantages. A disadvantage of using MACD is that moving averages lag behind price like other price-derived indicators. If you are a beginner, combine divergence with price action such as support or resistance levels to help identify stronger signals. If you rely only on MACD divergence for an entry into the market, you may often find you will get false positive divergence. False positive divergence occurs when price moves sideways. For this reason, just like moving averages which are also lagging indicators, the MACD indicator works best in trending markets.
Bonus tip – how to improve divergence setups
As I said at the beginning, I will now give you a bonus tip for using MACD. The tip is to connect the high or low swings at the most extreme endpoints on your chart when looking for divergence. It helps filter out many tiny and far less significant swings, which often give a misleading representation of divergence.
Look at this GBP/USD chart; we can see many swings we could use; however, the most recent extreme swing high is the one shown by the arrow in the chart example.
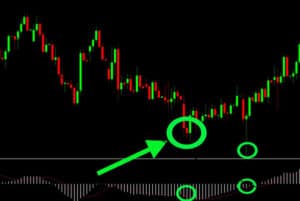
Identifying the more extreme swing highs or lows to draw divergence makes it simpler and easier to be consistent when using MACD divergence. This tip will help you avoid drawing divergence from recent tiny and less significant swings like this very small swing low on GBP/USD shown below.
Most of the time, if the MACD histogram shows divergence, the extreme swings will be far more significant in size and hold greater significance in terms of the overall trend divergence.
Summary
Here’s a list of some of the critical points covered earlier:
- MACD stands for Moving Average Convergence Divergence.
- MACD is a momentum indicator that shows the relationship between two moving averages.
- The default setting is 12,26 and 9. 12 shows the number of periods used to calculate the faster-moving average, and 26 shows the number of periods used for the slower-moving average. 9 is the number of bars used to calculate the moving average of the difference between the faster and slower moving averages. This difference is plotted by the vertical lines, called the histogram.
- MACD indicators are commonly used in one of two ways: by crossovers or for signalling divergence in the market.
- Divergence in a downtrend can be seen as price making lower swing lows, and the MACD histogram ascends when you connect the lower swing lows (and the opposite for an uptrend).
- Connect the swing highs or lows at the most extreme endpoints on your chart when looking for divergence to help you filter out less significant swings.
If you found value in reading this and are interested in learning more, check out the related post about regular & hidden divergence strategies.


