Trendlines are very popular for both technical and fundamental analysis-based traders and investors. Almost everyone will look at a significant trendline every now and then.
We’ll go through three key trendline factors to help increase your win rate when using trendlines. These factors can be beneficial for trading in any market and timeframe. A major reason why price action is often more valuable than indicators is that indicators are lagging, and price action shows what is currently happening.
Factor 1 – Proximity

The first key factor is the proximity of the trendline touches.
A helpful analogy to help understand why trendline touch proximity is important is to think of a trendline like a bridge. If a bridge has larger gaps between each support pier, then the structure of the bridge is weaker. The larger the gaps do not mean it’s a weaker trendline, but rather the size of the gaps relative to the smallest gap.
If the smallest gap is tiny (as shown on the chart), and the other gaps are a lot larger – this is a weak sign. This is because the market also considers time as a major factor along with price.
If the market can see the trendline moving in a timely sequence of recurring events, then the market will have greater confidence with that trendline or any other market event. Having a huge gap compared to the smallest gap between trendline touches tells the market that it’s not moving in a timely sequence.
Look at the trendline on the chart with strong proximity to see the difference. A structure with similar size gaps means the structure is well balanced.
This trendline you can see has swings off it that have a large gap between them. However, because the trendline has more than three other swing bounces off it with decent proximity – the trendline is quite strong. Having a smaller distance between each trendline high or low touch is like a bridge with smaller distances between each pier – which helps make it stronger.
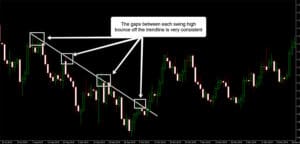
To determine if the proximity of the trendline touches are strong; we should have an idea of how to measure it.
When creating a rule to realise if a trendline has strong or weak proximity – keep it simple by rounding it to roughly 2 or 3 times the distance between each swing. For example, using 2.3 times as the maximum distance – you’ll first have to measure the chart with a ruler to get the precise figure. Also, you’ll likely forget this criteria as it’s so specific.
Be aware that a trendline without this criteria might be more substantial because there are other factors when analysing trendlines. It’s worth noting that this factor depends on other factors.
As a beginner, don’t worry about analysing this factor as other simpler trendline factors can give you strong trendlines -which we will go through next.
Factor 2 – Trend analysis
The next significant factor is to determine the overall trend. Identifying the overall trend can help better understand trendline breakout potential. This is because in a down trendline channel pattern, for example, if price breaks the top trendline, price is likely to make a greater move up as the top trendline break indicates a potential trend reversal.
If price breaks the bottom trendline in a downtrend, it will often make a smaller move in comparison. Of course, this also depends on the market environment – for example, stocks will likely trend longer than most major forex pairs. This is only sometimes the case however more times than not you will likely see this occur.
Determining the trend is largely an opinion – the reason is because the difference between a sideways, upward or downward trend is not defined. Every trader is likely to have a different perspective on the trend unless it’s clear and obvious.
Many traders use indicators to identify trends, however price action can give an effective indication of the trend. Look out for higher swing highs and higher swing lows if it’s an uptrend and the opposite for downtrends. Indicators for identifying a trend often add unnecessary clutter and confusion. Price action can give a better trend indication without added clutter.
There are many ways to identify a trend, therefore it’s best to try and keep it simple. A simple way for beginners to determine a trend is the following. Draw two horizontal lines across your chart with one at 25% height and one at 75% height. If price closes below 25% it’s likely a downtrend, and above 75% it’s likely an uptrend.
As shown by the chart example, anything between 25% to 75% is likely to be a sideways market. You can edit this to around 30% and 70% or whatever you like, however I recommend having at least 40% to 60% to filter out less obvious trends.
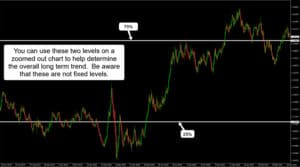
Trading trendline breakouts in trending markets is easier, therefore having an idea if a market is trending or not helps. Indicators or other fancy analysis tools to determine the trend is not worth it because it’s simple to analyse the overall trend.
Factor 3 – The number of touches
The number of touches off the trendline to analyse its strength is a popular factor. The more a trendline is tested the stronger it becomes – this is the same for horizontal support and resistance levels. It’s the clearest and easiest trendline factor for beginners.
To help identify better trendlines, connect upward trendlines to swing lows and downward trendlines to swing highs. A valid trendline should connect at least two swing lows or two swing highs. If you have 3 or more lows or highs off your trendline; the strength of your trendline increases (as shown in the examples).
Higher timeframe trendlines can have more touches than the trendlines on the timeframe you’re using. With multiple timeframe trendline analysis, be careful not to use timeframes far higher than the timeframe you’re on because the relevance decreases the higher you go. For example, if you use the 1-hour time-frame and your trendline is on the daily chart, the trendline likely may not fit accurately to the one-hour chart. On the 4-hour chart, however, the trendline is more likely to fit. Always look at the relevance when using multi-timeframe trendlines.
Tip for factor 3
Another factor is the size of the swing high or low off a trendline. How large does the swing size have to be to make it significant? The answer depends on the type of trader you are and the market environment.
For example, trading on the hourly timeframe on Euro/USD, you probably wouldn’t say a 5 pip swing is large enough; however, on the 30-minute timeframe, you might.
It also depends on the type of trader you are. For example, a discretional trader, may say 5 pips is fine for the 30-minute timeframe but only if there are other strong discretional factors for the setup.
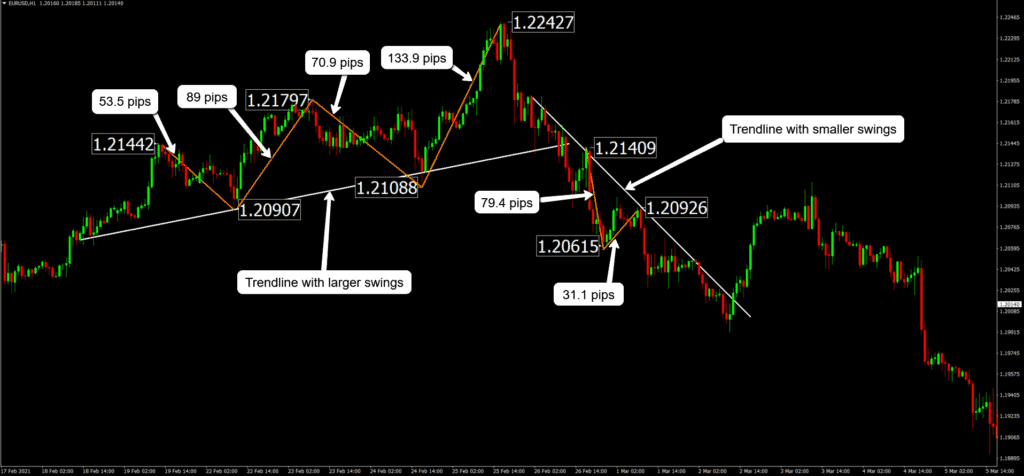
Look at the two trendline examples on the Euro/USD H1 chart below.
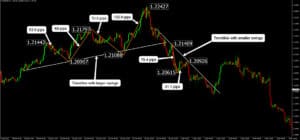
The second trendline had smaller swings off it and made a small move after the breakout compared to the first trendline. The first trendline clearly has much larger swings bouncing off it – as shown by the orange lines with the pip amounts labelled to swings off the trendline.
One of the smaller swings off the first trendline was 142.5 pips (53.5 pips + 89 pips) compared to the largest swing on the second trendline which was 110.5 pips (79.4 pips + 31.1 pips).
A breakout of the first trendline with larger swings off it would likely cause a larger trend – even though both trendlines had many touches and both had strong proximity with the touches. The second trendline is not weak; it’s just that if you’re looking for a significant breakout, you’re more likely to get it from the first trendline. A reason why this happened is because market participants are more likely to notice the first trendline compared to the second.
However, a disadvantage of larger trendline patterns is that your stop-loss position will be greater, perhaps around the 1.22427 level. If your entry is around 1.21409 to hit a 1 to 1 risk to reward the breakout would have to move far more compared to the second trendline with smaller swings off it.
Trendlines with smaller swings off it are likely to be steeper and therefore allow a tighter stop-loss. Although this is the case, most of the time you’ll be better off looking for larger swings off the trendlines because more market participants notice those trendlines.
Also, with larger swing sizes you’ll have greater flexibility to reduce risk by adjusting your stop loss. Additionally, it can help avoid slippage from major news releases. Don’t worry about measuring each swing precisely as shown in the example; instead, try to have a rough idea that the swings are large enough to take notice.
Summary
Many other factors determine the strength of trendlines. It’s crucial, especially for beginners to keep it simple. Keeping it simple will help execute your trading plan with greater accuracy. Use some of the most significant factors and you won’t overcomplicate your trading plan.
To start, try using trendlines with at least 3 or more highs or lows to help filter out higher-quality trendlines. Meanwhile, test other trendlines to see the difference in your results. If you’re interested in learning more about trendlines, make sure you check out the related post about flag and wedge pattern trading.

